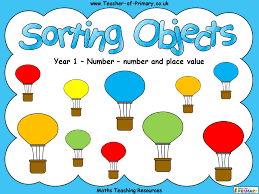
Toán song ngữ Toán tiếng Anh Sắp xếp Sorting
Học sinh lớp 1 học cách sắp xếp, biểu diễn và mô tả dữ liệu với các nhóm, nêu tổng số lượng các nhóm, số thành phần trong mỗi nhóm và so sánh thành viên trong từng nhóm.
Examples, solutions, videos, and songs to help Grade 1 kids learn how to organize, represent, and interpret data with up to three categories; ask and answer questions about the total number of data points, how many in each category, and how many more or less are in one category than in another.
Suggested Learning Target
- I can organize data in up to three categories.
- I can represent data in up to three categories.
- I can answer questions about the total number of data points and how many data points are in each category.
- I can sort data into separate categories
- I can display data in appropriate graph, such as a picture graph
- I can answer questions about the data such as ‘Which category has more?’ ‘Which category has less?’ ‘What is the favorite snack of our class?’ ‘How many more stickers does Sam have than John?’
Bình luận
Có thể bạn quan tâm:
-
Tìm thầy cô dạy toán tiếng anh toán timo hkimo cho học sinh lớp 1 2 3 4 5 tại Tây Hồ 31.3.25
-
Lớp học toán Timo toán tiếng anh cho học sinh lớp 1 2 3 4 5 tại Tây Hồ
-
Lớp học tiếng anh dành cho học sinh tiểu học khu vực Tây Hồ
-
Toán tiếng anh Toán song ngữ ôn tập Sắp xếp Sorting Data
-
Toán tiếng anh Toán song ngữ ôn tập thời gian Time revision
-
Toán tiếng anh toán song ngữ ôn tập trọng lượng độ dài độ cao dung tích


